Detecting recombination in RDP4
What you will need:
-RDP4
-Optional: Python 2.7 or greater
Detecting recombination using RDP4
In this tutorial we will use the Recombination Detection Program RDP4 to detect recombination events in a sample of SARS-like coronaviruses. RDP has its own recombination detection method, but the great thing about RDP4 is that it runs a suite of algorithms to automate the detection of recombination in a sequence alignment (Martin et al., 2015). This includes the 3SEQ algorithm we discussed in class as well as several other common statistical tests for recombination. This is useful since different tests vary dramatically in their underlying assumptions, detection power and sensitivity. Running several different tests therefore allows us to see which recombination events are supported by multiple detection methods. If you are interested in the statistical performance of the various methods employed by RDP4, check out Figure 3 in Martin et al. (2016).
Recombinant coronaviruses and host jumps
One big reason why we care about recombination is that it can create new pathogen genotypes by combining different mutations in a common genetic background. This includes the ability to combine multiple beneficial mutations which may allow emerging viruses to jump between host species and rapidly adapt to new hosts. For example, it has been proposed that recombination between different SARS-like coronaviruses may combine mutations in the Spike attachment protein that allow the virus to bind cellular receptors in different hosts and thereby facilitate cross-species host jumps (Graham and Baric, 2010).
Here, we will explore the history of recombination events between coronaviruses sampled from humans and bats. The sequence data include 14 coronavirus reference genomes, including SARS-CoV and the SARS-CoV-2 reference sampled from Wuhan back in 2019. I downloaded these reference genomes from GenBank and then aligned the sequences using MAFFT. A FASTA file containing the aligned viral genomes can be downloaded using the link below:
Installing RDP4
You can download RDP4 here. Make sure you download using the link to the most up to date stable version of the program (RDP4.101).
Note for Mac Users:
RDP4 is distributed as a Windows executable file. To run in Mac OS, you will also need to download and install the PlayOnMac emulator. Once you have PlayOnMac installed, you should be able to launch the RDP4 executable (.exe) file. The first time you open RDP4, PlayOnMac will also try to install XQuartz. You might need to manually download and install XQuartz first, otherwise the download step during installation would time out.
As of February 2026, I have not been able to get RDP4 to run via PlayOnMac on an Apple Silicon chip (e.g. M4).
Automating detection in RDP4
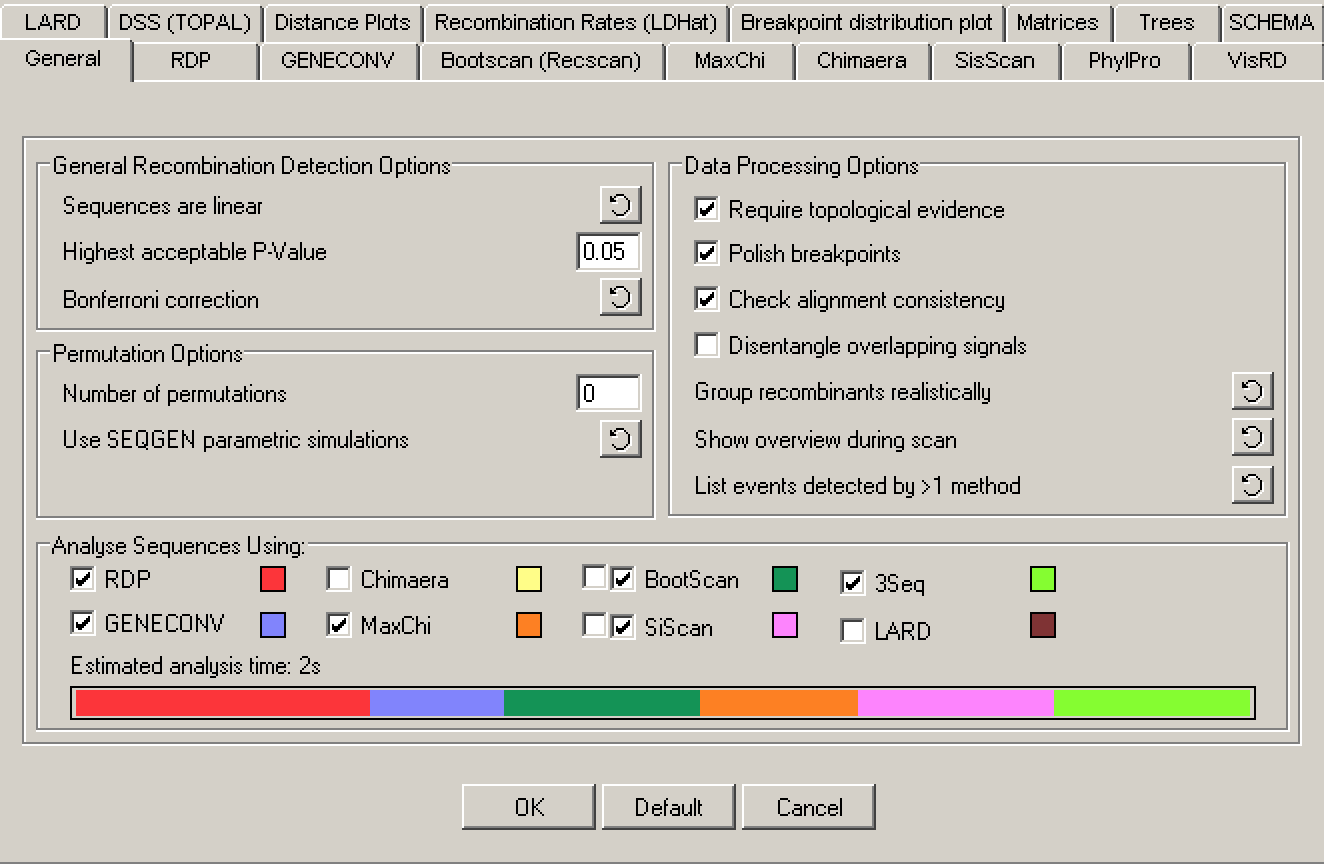
In RDP4 click Open and then select the FASTA file containing the CoV alignment. Next, select Options and move to the General options panel. Under General Recombination Detection Options make sure “Sequences are linear” is selected. Under Data Processing Options, select “Require topological evidence”, “Polish breakpoints”, and “Check alignment consistency”.
“Polish breakpoints” can be deselected to speed up analysis of larger datasets, but here we will leave it selected because it substantially improves the accuracy of breakpoint locations. You can also select “Disentangle overlapping events”, which will help the program avoid detecting recombination between pairs of sequences already identified to be recombinants (i.e. recombinants of recombinants), but this can cause the program to get stuck in a circular loop.
Under Analyze Sequences Using you can select the detection algorithms RDP will run (some will run automatically). The default choices include 3SEQ, and are appropriate for us here as they provide a good balance between detection power, sensitivity and speed. Click OK once the General options window looks as below.
Select Run → Do a full exploratory recombination scan. Once the analysis has finished running, we can explore each proposed recombination event in different ways. In the bottom right corner, we can see the Schematic sequence display. The colored blocks in this window graphically represent the identified recombination events. Each sequence is represented as a block and beneath it the colored strips represent potential recombination events occurring within that sequence.
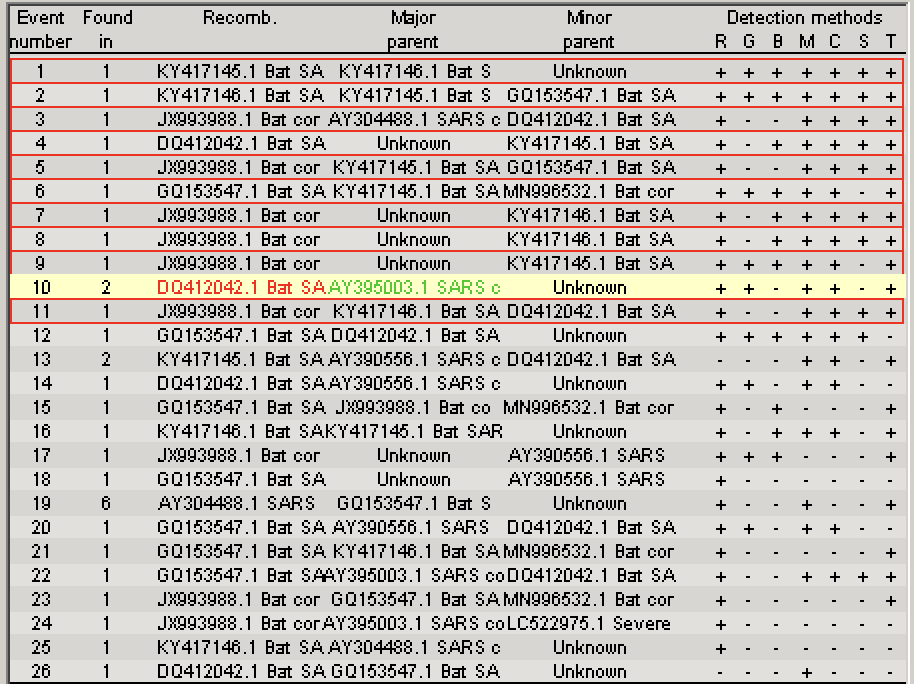
In the top right corner is the Recombination information window, which lists all identified recombination events, the most likely parent sequences and which detection methods positively identified the recombination event.
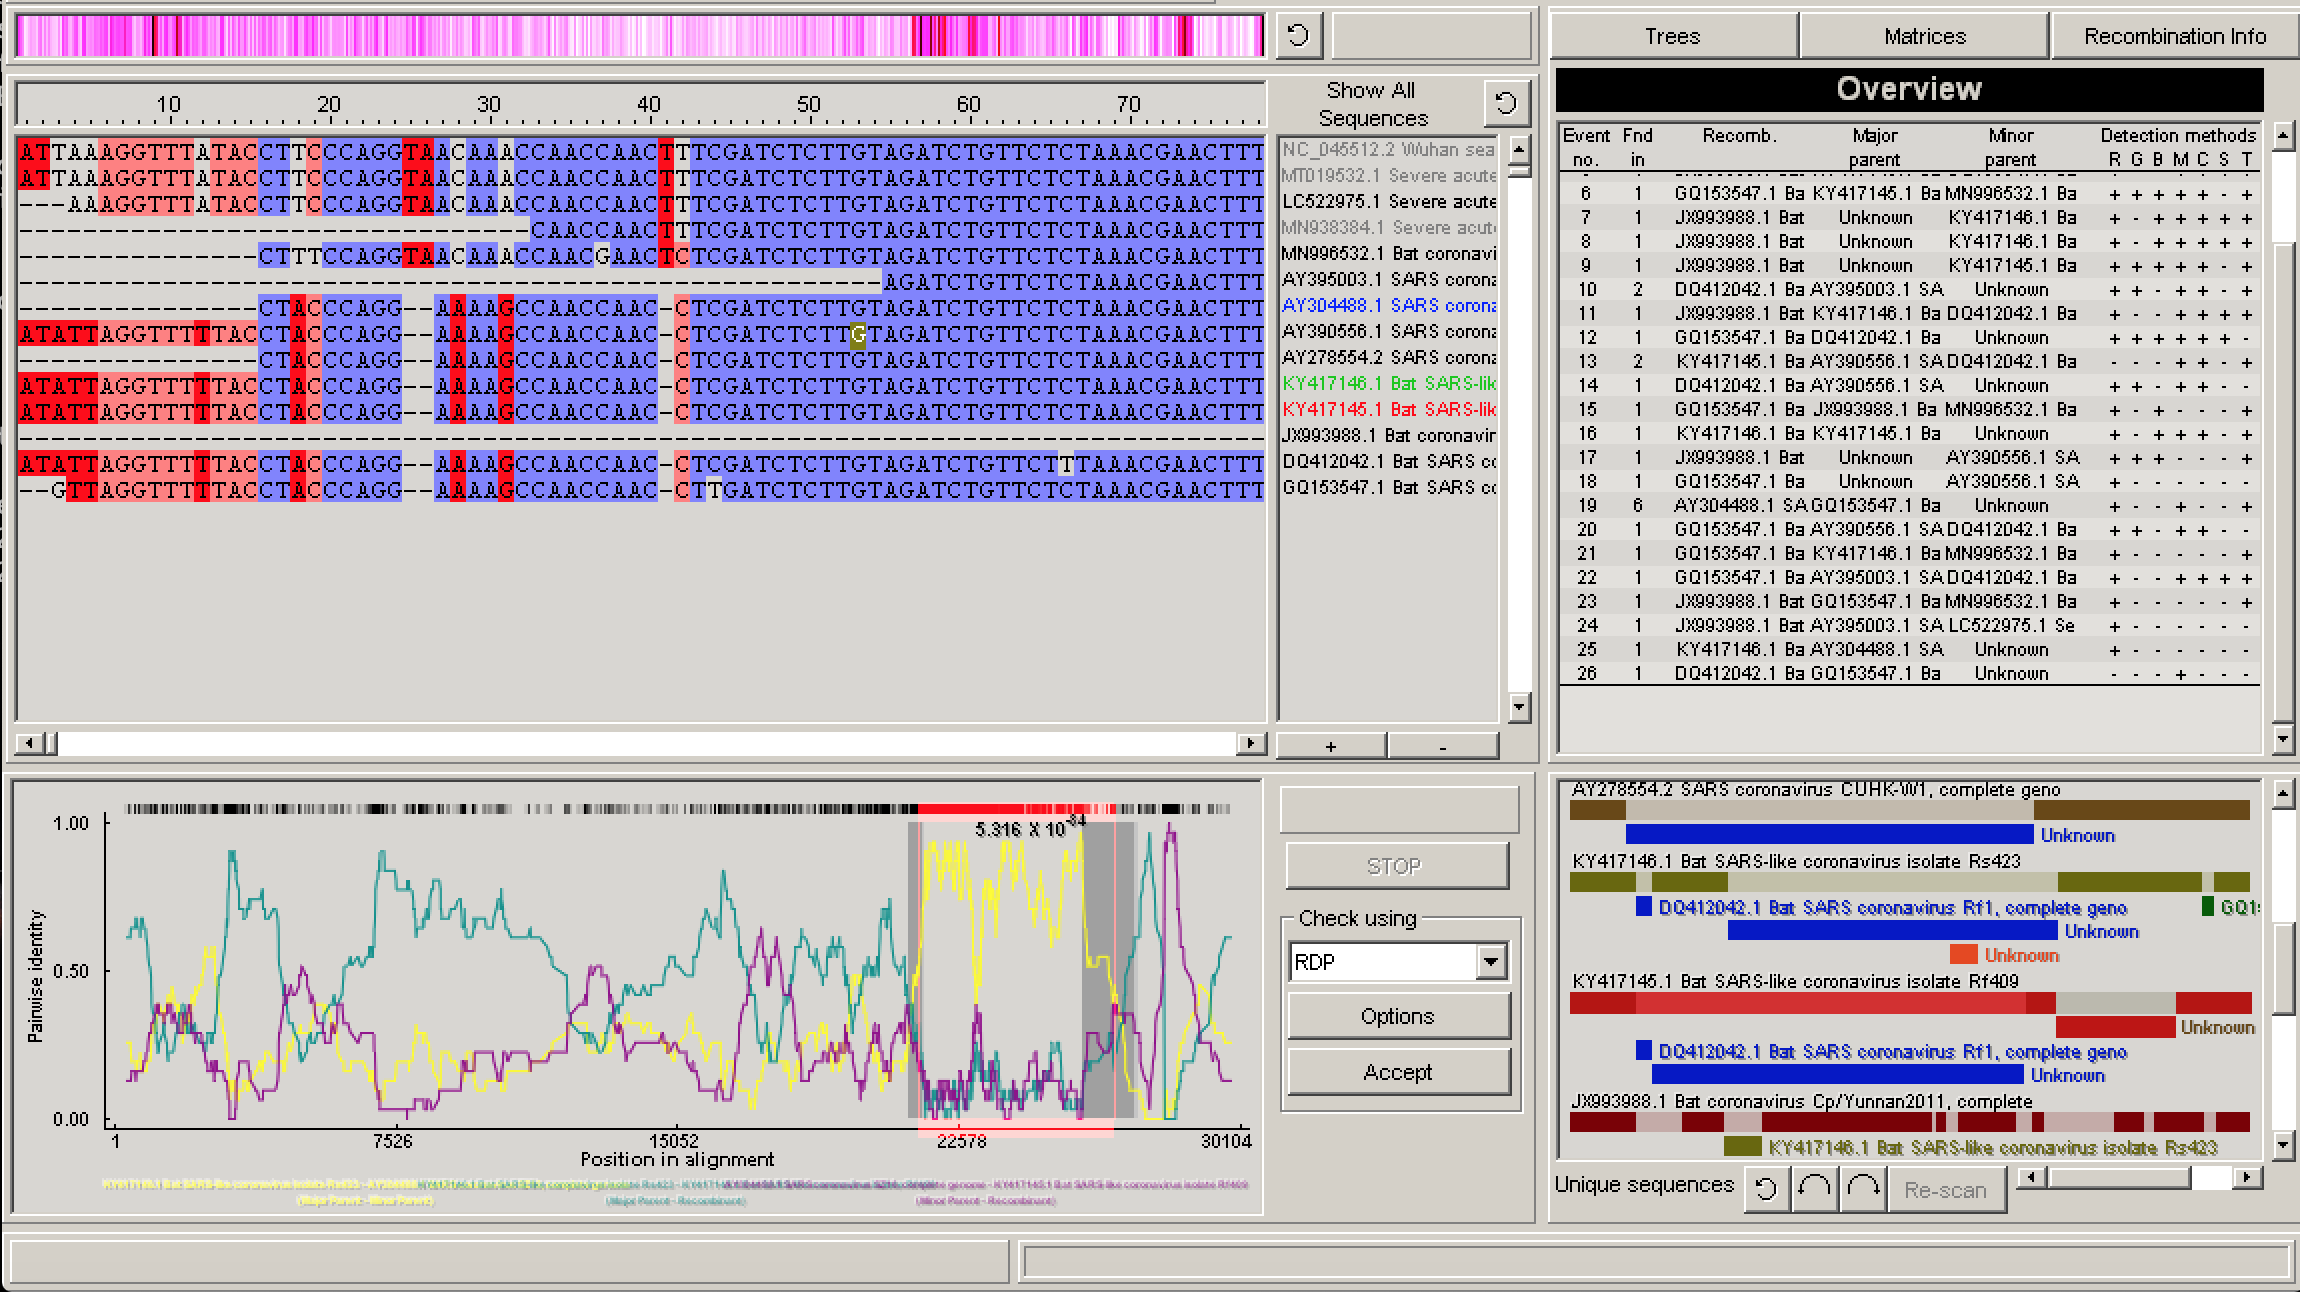
If you select a recombination event, either by clicking on one of the events in the Recombination information window or one of the colored blocks in the Schematic sequence display, you can then click Recombination info to get more detailed info about the event, including warning flags that RDP4 throws if there is a high probability that the event is a false positive or if there is substantial uncertainty surrounding the event.
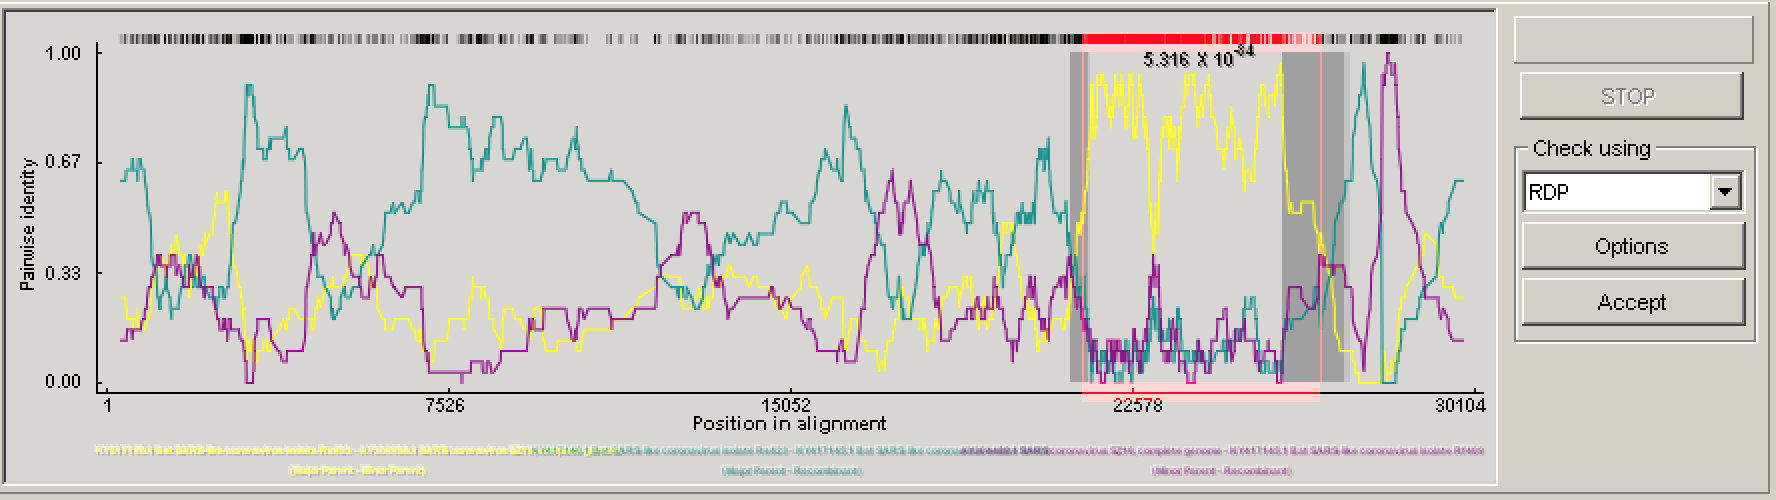
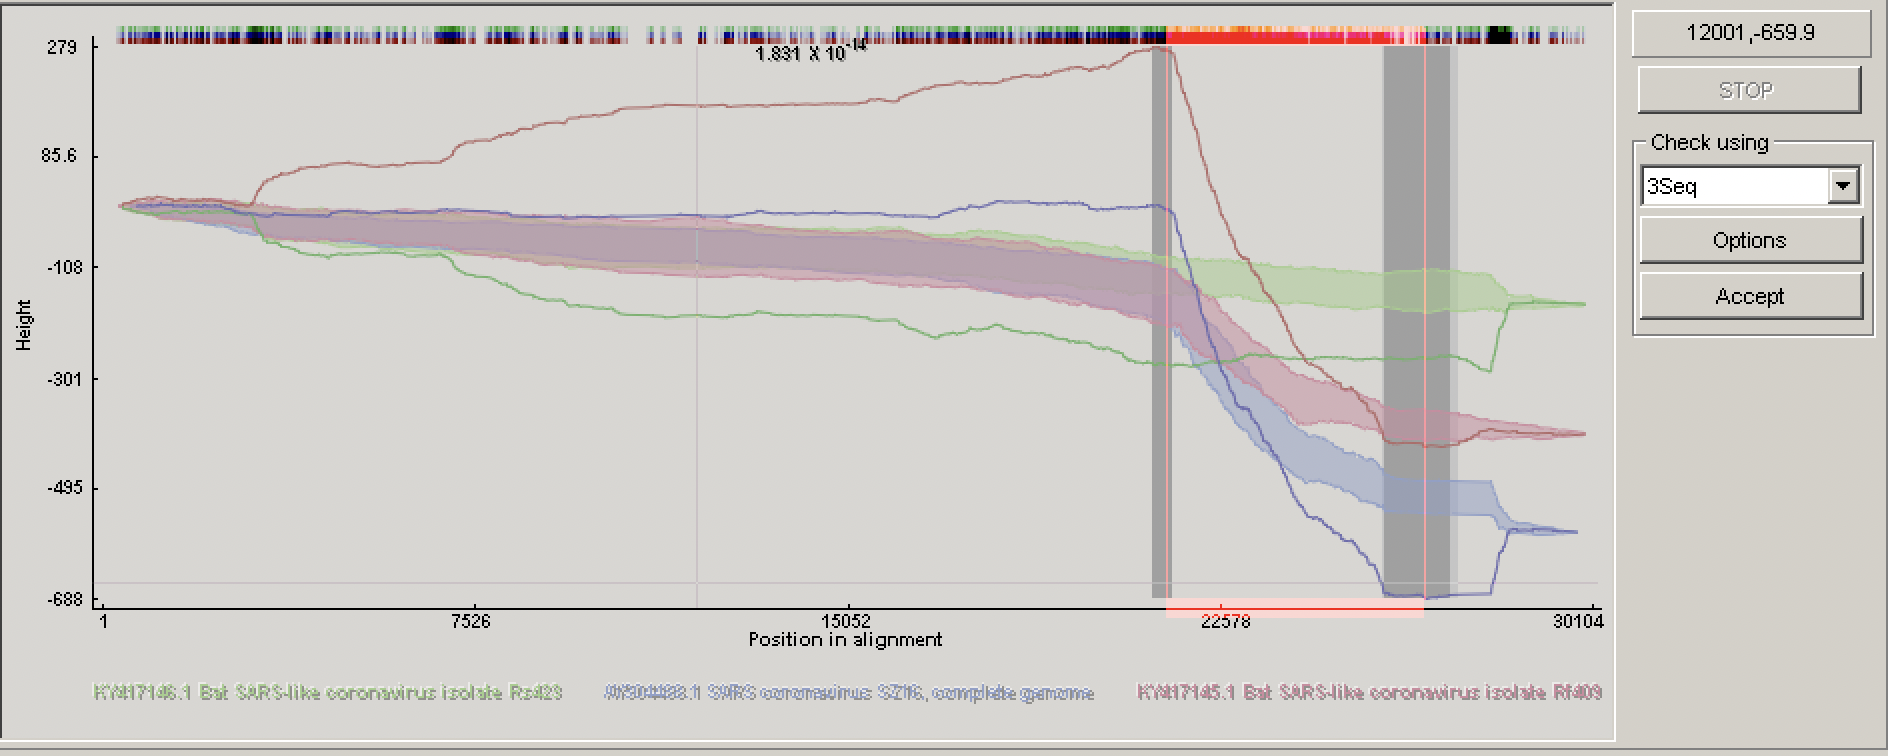
In the lower left panel, RDP4 will plot visual evidence for a given recombination event under a specified test. For example, in the figure above the pairwise identity between the probable recombinant sequence and parents dramatically jumps between different parents in the region between the identified breakpoints. In the top left window, you can visually explore the relationship among the recombining sequences in the alignment.
Analyzing individual recombination events
The tests that RDP4 runs are largely heuristic, and there is no guarantee that the automated scan we ran detected all recombination events or does not include false positives. Each detected recombination event is best thought of as a hypothesis that needs further testing and possible manual refinement.
The identified recombination events are listed in sequential order from the most obvious and consequential to the least important. The RDP4 user guide recommends that manual inspection should proceed in sequential order because mistakes identifying the first and most important events will have the most impact and any errors here will tend to propagate down through the analysis.
We will therefore analyze each event one-by-one in the order they are listed in the top right Recombination info window. In my analysis, the first event involved Bat SARS-like coronavirus isolate Rf409. Here, there is fairly unambiguous evidence that this is a true recombination event. All of the tests run by RDP4 positively identified this event and the pairwise identify clearly shifts dramatically between parents in the display plot, showing a clear signal for recombination. The gray shaded interval in the plot indicates the 95% credible intervals for the breakpoint locations.
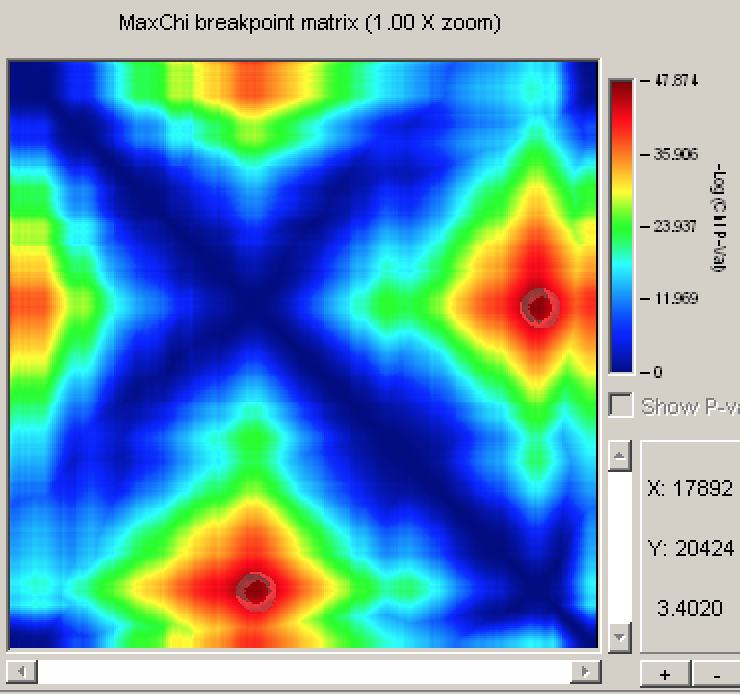
The RDP4 user guide recommends RECSCAN, 3SEQ, MAXCHI, and CHIMAERA as the best methods for pinpointing the precise location of recombination breakpoints. If you click on Matrices above the Recombination info window, a heat map showing the most probable location of the left and right breakpoints according to MAXCHI is displayed.
Let’s look at the 3SEQ diagnostics using Check by → 3seq in the lower left panel. You should see three colored lines corresponding to the analysis run with each sequence in the triplet as the (possibly recombinant) child sequence. These lines correspond to the “random walk” we discussed in lecture where up steps indicate a mutation shared in common with the top parent and down steps a mutation shared in common with the bottom parent. Recall that a rapid rise/fall with many sequential steps in the same direction indicate a potential recombination event that is unlikely to have evolved randomly by mutation alone without recombination. The colored shaded regions give the credible intervals: if the lines fall outside of these regions the observed order of mutations is unlikely to have occurred by chance and so we can conclude there is strong support for the child being a recombinant. In this case, the lines for all three potential children fall outside of the shaded intervals, strongly supporting a recombination event in the region between genomic coordinates 21498 and 25811. Note though that in this case the minor parent is unknown, suggesting that all three of these sequences may have acquired this region of their genome from a shared but unsampled parent lineage.
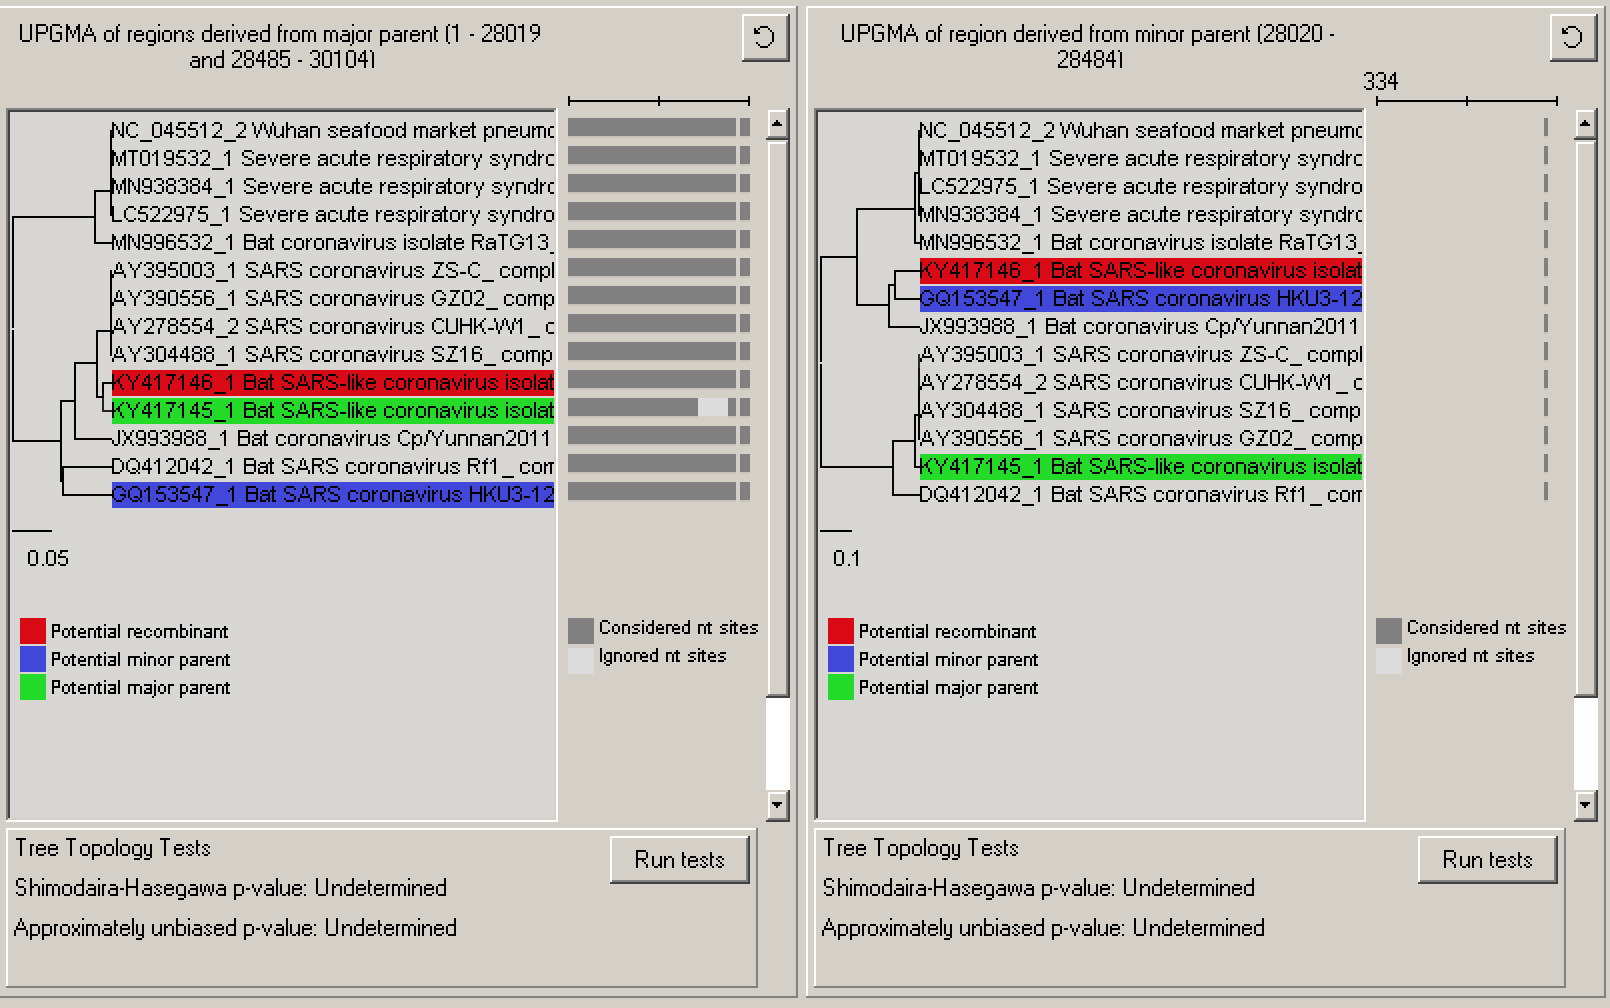
We can also consider phylogenetic evidence for whether or not recombination has been correctly identified. Continue on to the second recombination event by selecting it in the Recombination info window. Selecting Trees will produce a new window with two trees side-by-side, one inferred from the portion of the alignment outside of the recombinant region and a second inferred from the portion between the identified breakpoints. Here we can see that there is strong evidence for the recombination event based on phylogenetic discordance: in the first tree the recombinant sequence’s nearest neighbor is the potential major parent but in the other tree, the recombinant sequence clusters with the minor parent. This discordance in the relationship among the recombinant sequence and the major and minor parents can be considered as strong additional evidence for the recombination event.
Verifying and accepting recombination events
We can now analyze the potential recombination events in sequential order, accepting or rejecting each event based on the evidence provided. You can right click on an event in either the Recombination information window or the Schematic sequence display, and then accept or reject the proposed event. Once an event is accepted, a red box will appear around it and that event will automatically be accepted in any subsequent scans for recombination.
Unfortunately, there is no single, universally agreed upon standard for how to accept/reject potential recombination events. But I would suggest basing your decision on the following criteria:
- Do the majority of detection methods provide positive evidence?
- Does RDP4 warn that this may be a false positive in the Recombination information window?
- Do standard tests like RDP or 3SEQ provide credible evidence for recombination?
- Do the trees show phylogenetic discordance supporting the event?
If a large number of events are rejected, it is worth running the recombination analysis again by hitting the Re-scan button. Rescanning after removing the rejected events should improve RDP4’s ability to detect genuine recombination events.
The figure below shows the recombination events I accepted in red.
Saving results
There are a couple of different ways to save results from a recombination analyses in RDP4. You can “Save recombination results to a .rdp project file” if you want to be able to reload your analysis into RDP4. Alternatively, you can “Save results to an excel readable .csv file” if you just want a record of the recombination events, parent sequences and breakpoints the program identified.
Generating recombination-free alignments
Now that we have accepted or rejected the identified recombination events, we can create a new recombination-free alignment. There are several ways we could do this. We can save an alignment with recombinant sequences completely removed, with tracts of sequences between recombination breakpoints removed or split the alignment into multiple sub-alignments based on the detected recombination breakpoints. We will choose the later option since there is too much recombination to just ignore the recombinant sequences. Also, we might want to reconstruct local phylogenies for each non-recombinant segment of the genome. To do this, select Save → Split the alignment into multiple new alignments based on detected breakpoint positions. RPD4 will then ask you if you would like to save the alignments for manually accepted recombination events, to which you should answer Yes.
This will produce a set of FASTA files each containing a sub-alignment for a segment of the genome labeled by their corresponding nucleotide positions.
Optional: Plotting tanglegrams in Python
One way to visualize recombination is to plot sequential tanglegrams which nicely emphasize phylogenetic discordance between local trees for different regions of the genome. We will use Gytis Dudas’ excellent baltic package in Python to plot tanglegrams for our coronavirus samples.
I reconstructed local phylogenetic trees for the first six sub-alignments exported from RDP4. This spans about the first 20kb of the CoV genome. Arguably, it would have been more interesting to look at local trees in the 3’ end of the genome which encodes the modular Spike domain involved in host adaptation, but unfortunately the recombination breakpoints in this region are too close together to provide long enough sub-alignments to be able to reconstruct local trees accurately.
I reconstructed maximum likelihood trees for each sub-alignment in RAxML under a GTRGAMMA substitution model, as we did in the first week of class:
raxml -m GTRGAMMA -p 12345 -s sars-like-CoVs-sub_1-2936.fas -n sars-like-CoVs-sub_1-2936 -T 2
I then used FigTree to midpoint root the best ML tree for each sub-alignment and transformed the branch lengths into a cladogram such that all the tips are equidistant to the root. This will make the tanglegrams look much nicer!
These trees are available in the GitHub repo for this week as NEXUS files. The baltic.py and PlotTanglegrams.py code you will need is also in this repo, so it’s probably easiest to just download the entire repo.
Navigate to the folder with the code and trees you downloaded. From the command line, you can then run the Python script like:
python PlotTanglegrams.py
This should generate a .png image file with our coronavirus tanglegram.
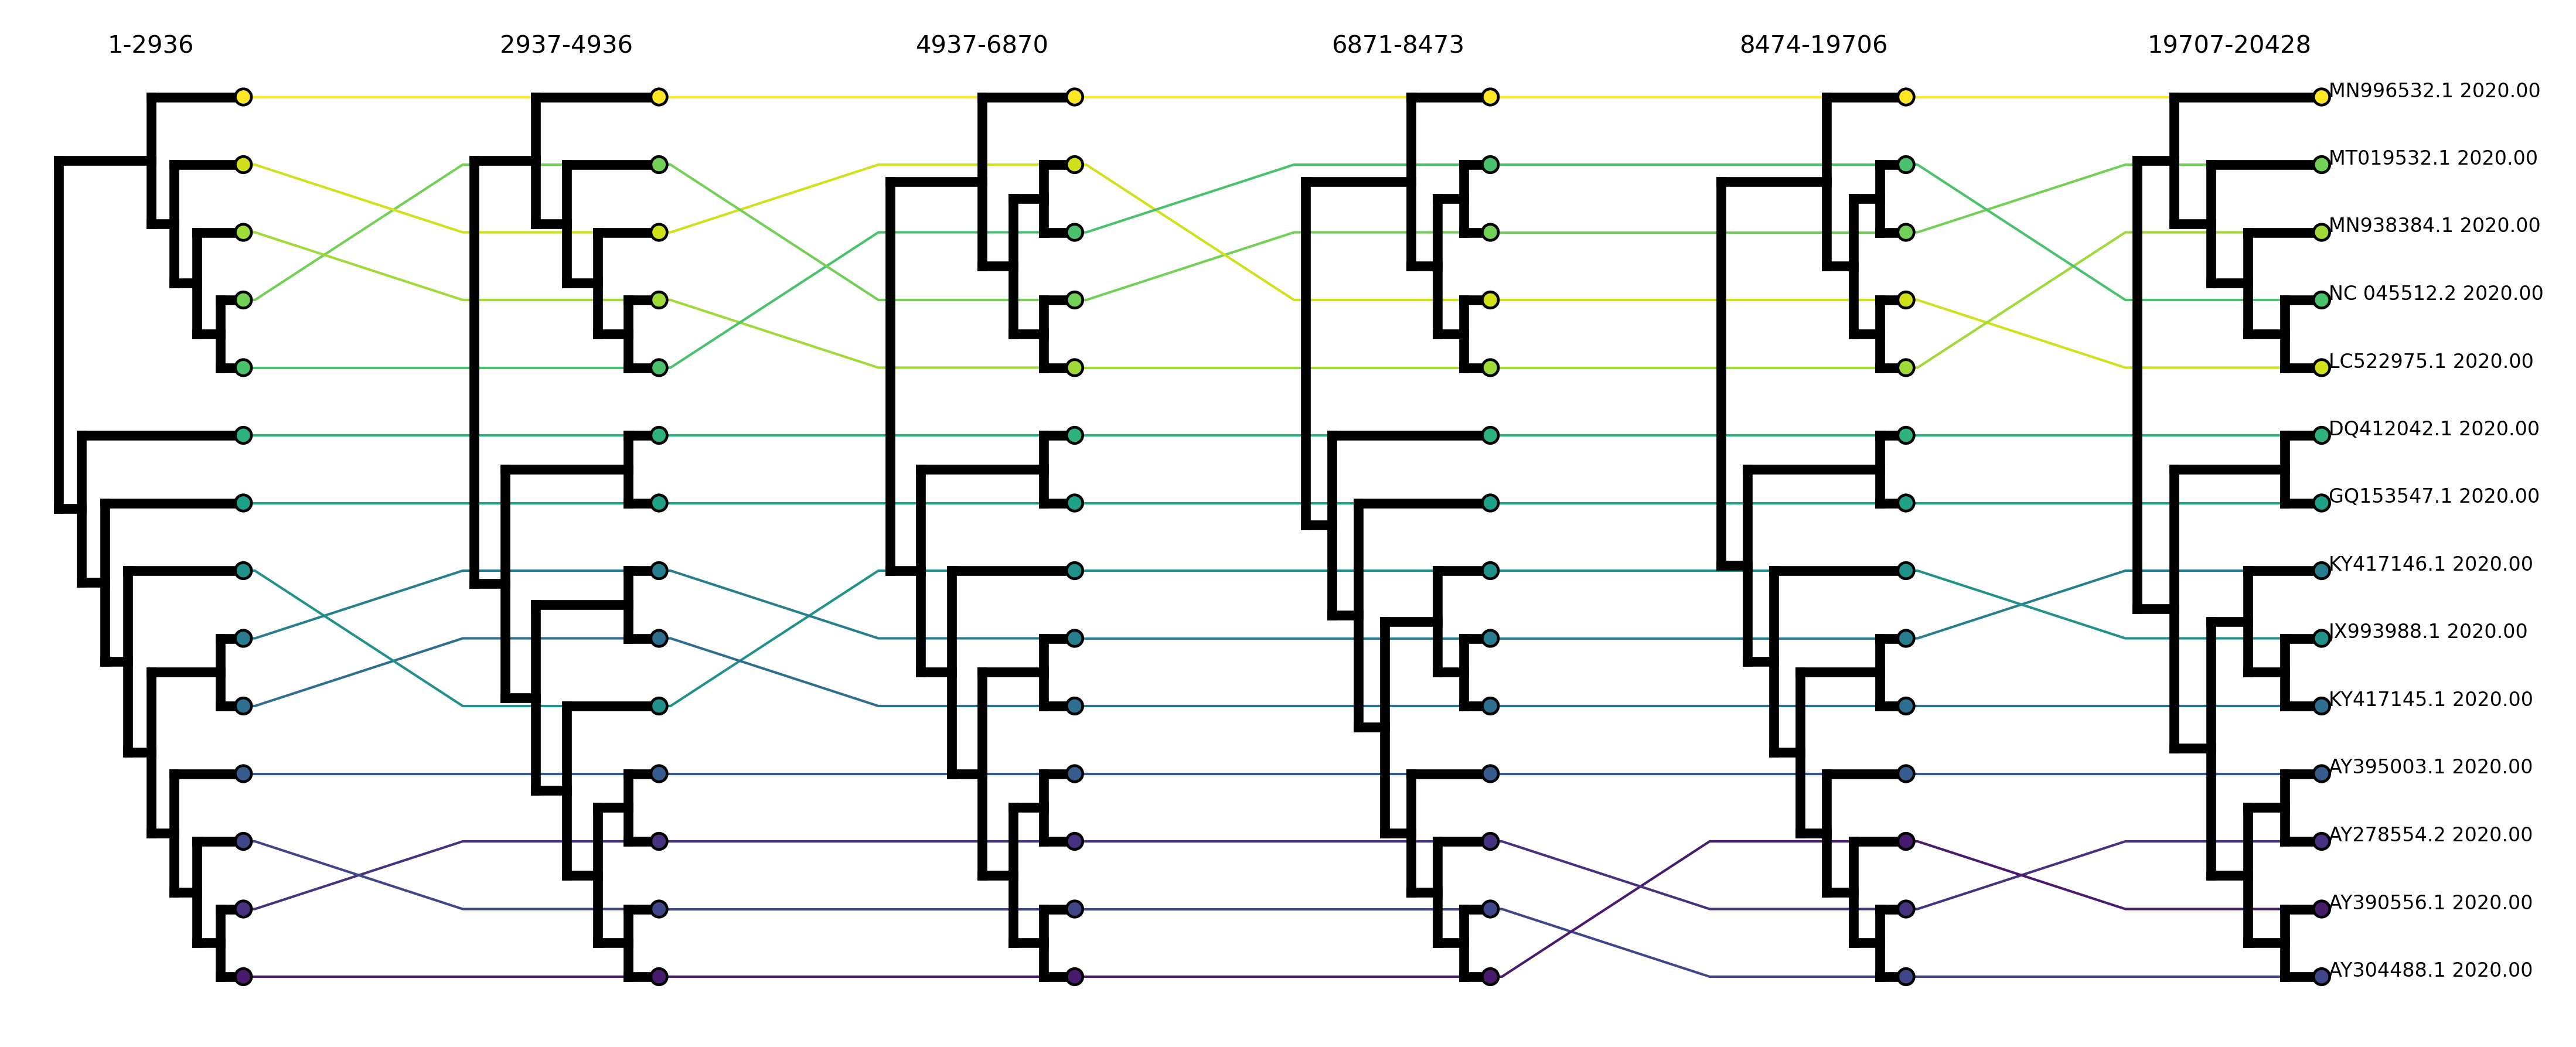
Phylogenetic discordance indicative of possible recombination are displayed as crossing lines connecting tips in neighboring local trees, whereas straight lines between tips indicate the phylogenetic relationships among the sequences has been conserved. As you can see there’s potentially quite a bit of recombination going on here.
If you want to expand this analysis to more segments of the CoV genome, you can reconstruct trees in RAxML from the sub-alignments RDP4 generated. To include these in the tanglegrams, you should just need to modify the segments list in PlotTanglegrams.py specifying the file names for the local tree of each genome segment.
# Can add more tree files for additional genome segments
fig_name = 'CoVSequentialTanglegram.png'
tree_file = "sars-like-CoVs-sub_"
segments=['1-2936','2937-4936','4937-6870','6871-8473','8474-19706','19707-20428']